A clearer view of community operations.
Bringing disconnected files into a repeatable dashboard for the decisions a residential community makes each week.
- Context
- Volunteer committee work
- Built with
- Excel · Python · HTML · Claude
- Documented
- 27 July 2026
The problem
Helpdesk tickets, collections, financials and action items were spread across different tools. A useful overview needed a reliable way to bring those files together.
The approach
I organised the data in a master Excel workbook and used Claude to help build a Python script that produces an HTML dashboard. Each refresh runs the same script against updated data.
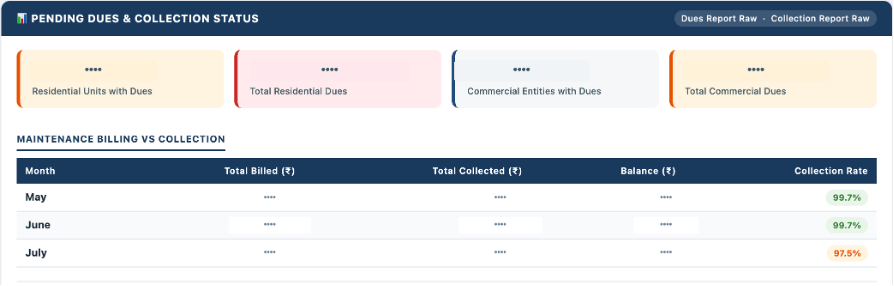
See the collections view
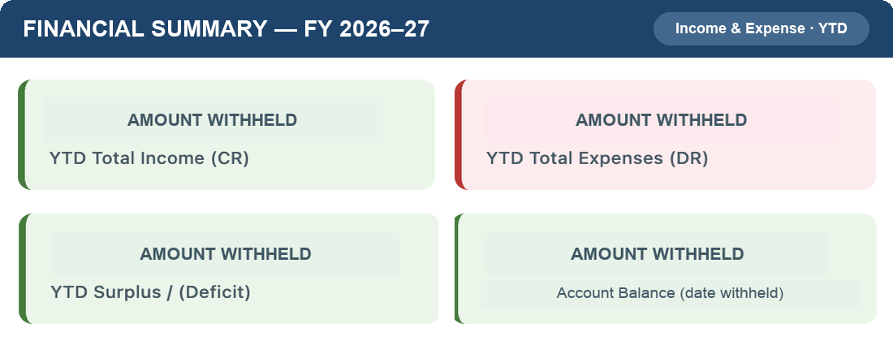
Another screenshot from the original write-up; masked figures are preserved.
What needed fixing
The first version needed corrections to ticket date filtering, the opening balance calculation, and the distinction between open and closed actions.
What I took away
Stable inputs and repeatable generation mattered as much as the first screen. The weekly task became updating the source data and rerunning the script.
Based on my July 2026 project write-up.
Working on something similar?
Ask about a build, share your experience, or send an idea.

